 4
4Use ChatGPT Stock Analysis Chatbot to Generate Professional Charts of Financial Data
Use ChatGPT Stock Analysis Chatbot to Generate Professional Charts of Financial Data
In this blog, we will introduce how to use ChatGPT stock analysis chatbot to quickly generate professional charts of financial data. A few AI techniques such as RAG (Retrieval Augmented Generation), Text2SQL, and Larget Language Models (LLM) are used to help users find financial data, draw chart to compare key metrics, and adjust the color and shape of the chart using simple natural language prompts. A typical scenrio for professional financial analysts is to draw chart to compare the market capitalization, PE ratio of stocks from global market in converted currencies (US Dollars for example). This is a frequent scenario of daily workflow. The snapshots of AI generated charts is shown using DeepNLP Financial Assistant. You can try by clicking the button below the page, copy and paste the query in the chatbox and ask AI to generate charts or tables in few seconds, copy the charts to your reports or send to your manager. From the chart, we can see that on January 15th, Microsoft (MSFT) market cap reaches 2,887 Billon US dollars, and Apple (AAPL) reaches 2,874.68 Billion US dollars. Microsoft's market cap surpassed Apple and became the company of largest market capitalization in United States. The real-time stock data is from the web APIs, and converted to SQL using Text2SQL and LLM techniques.
Navigation
- Draw charts and tables to display financial data
- 1. US Stock Market (NASDAQ and NYSE)
- Microsoft VS Apple Market Cap
- Compare US Market Top Tech Companies
- Alibaba VS PDD
- 2. China Stock Market (Hkex Shanghai Shenzhen)
- Kuaishou VS Meituan Market Cap and stock price
- Tencent VS Alibaba
- 贵州茅台 VS 中国移动
- 3.London Stock Exchange (LSE)
- Shell and Unilever
- 4.National Stock Exchange (NSE) of India
- Tata Motors and Infosys
-
-
Draw a bar chart to compare Microsoft and Apple market cap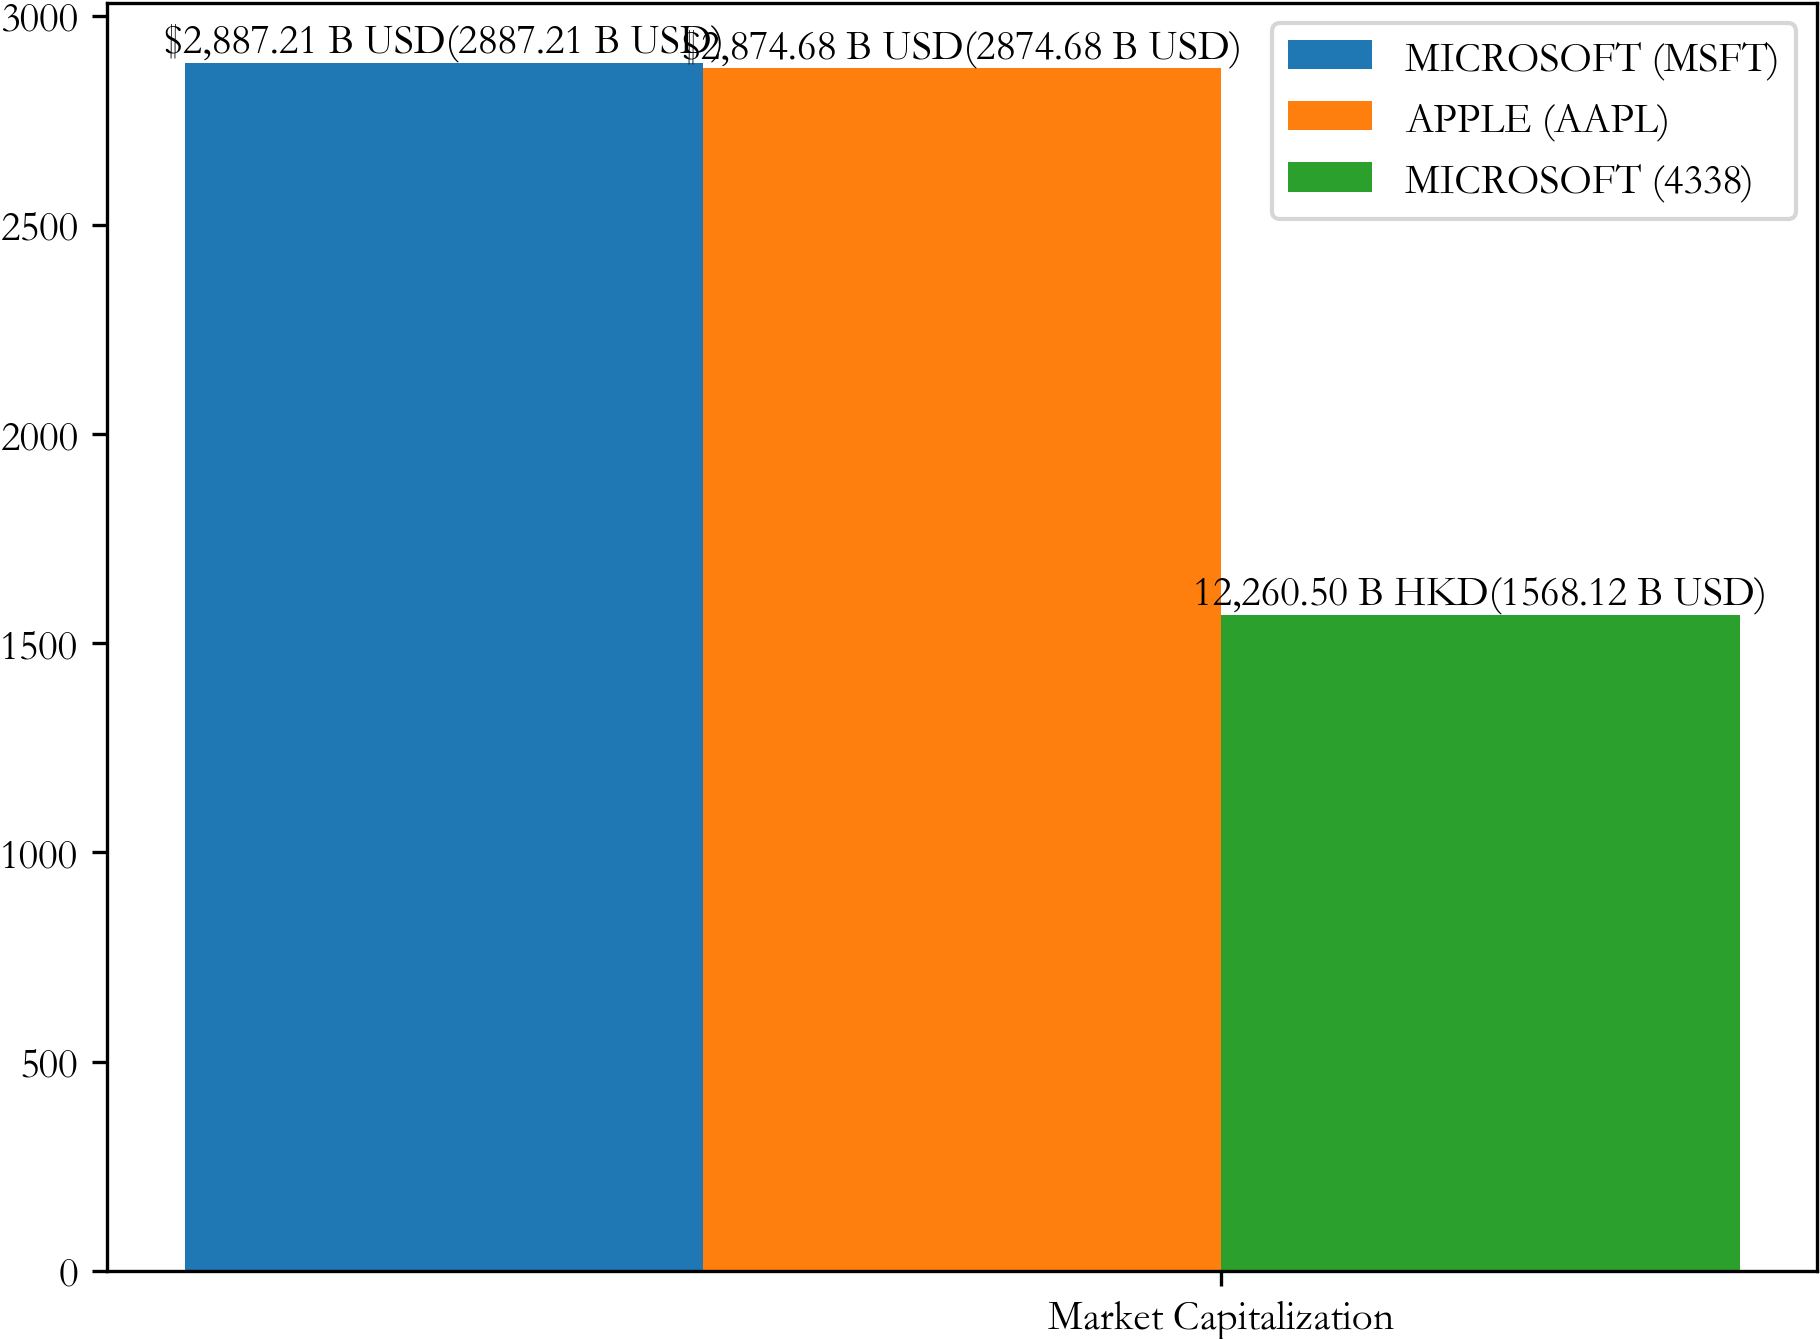
From the chart, we can see that on January 15th, Microsoft market cap reaches 2,887 Billon US dollars, and Apple (AAPL) reaches 2,874.68 Billion US dollars. Microsoft's market cap surpass Apple and become the largest market cap companies in United States.
-
Compare US Market Top Tech Companies
Draw bar chart to compare Google Apple Microsoft and Nvidia market cap
-
Compare Alibaba and PDD market cap and pe ratio, draw a bar chart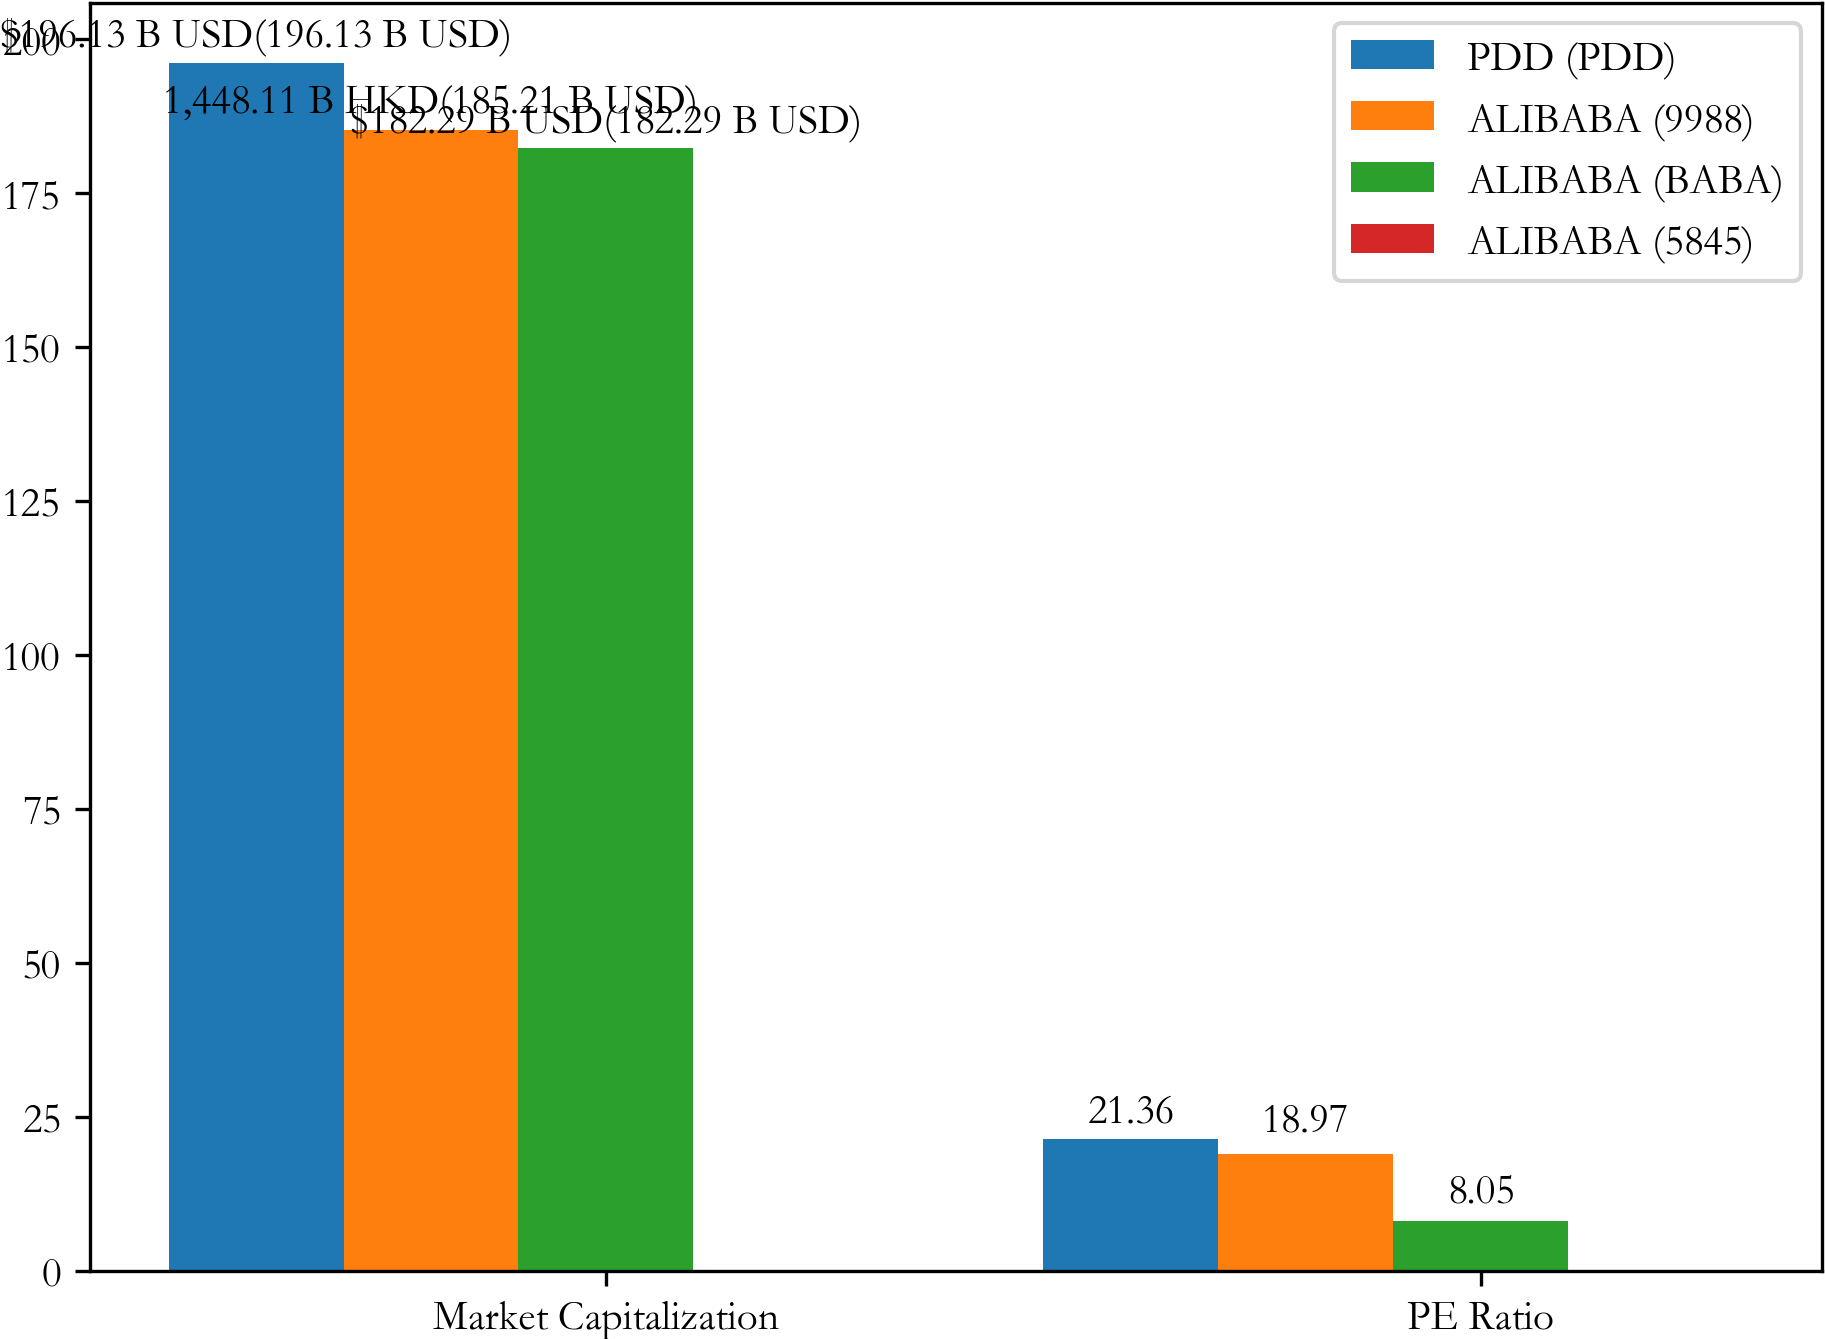
-
Kuaishou VS Meituan Market Cap and stock price
Draw chart to compare Kuaishou and Meituan market cap and stock price
-
Draw a table to compare stock price and market cap of Tencent and Alibaba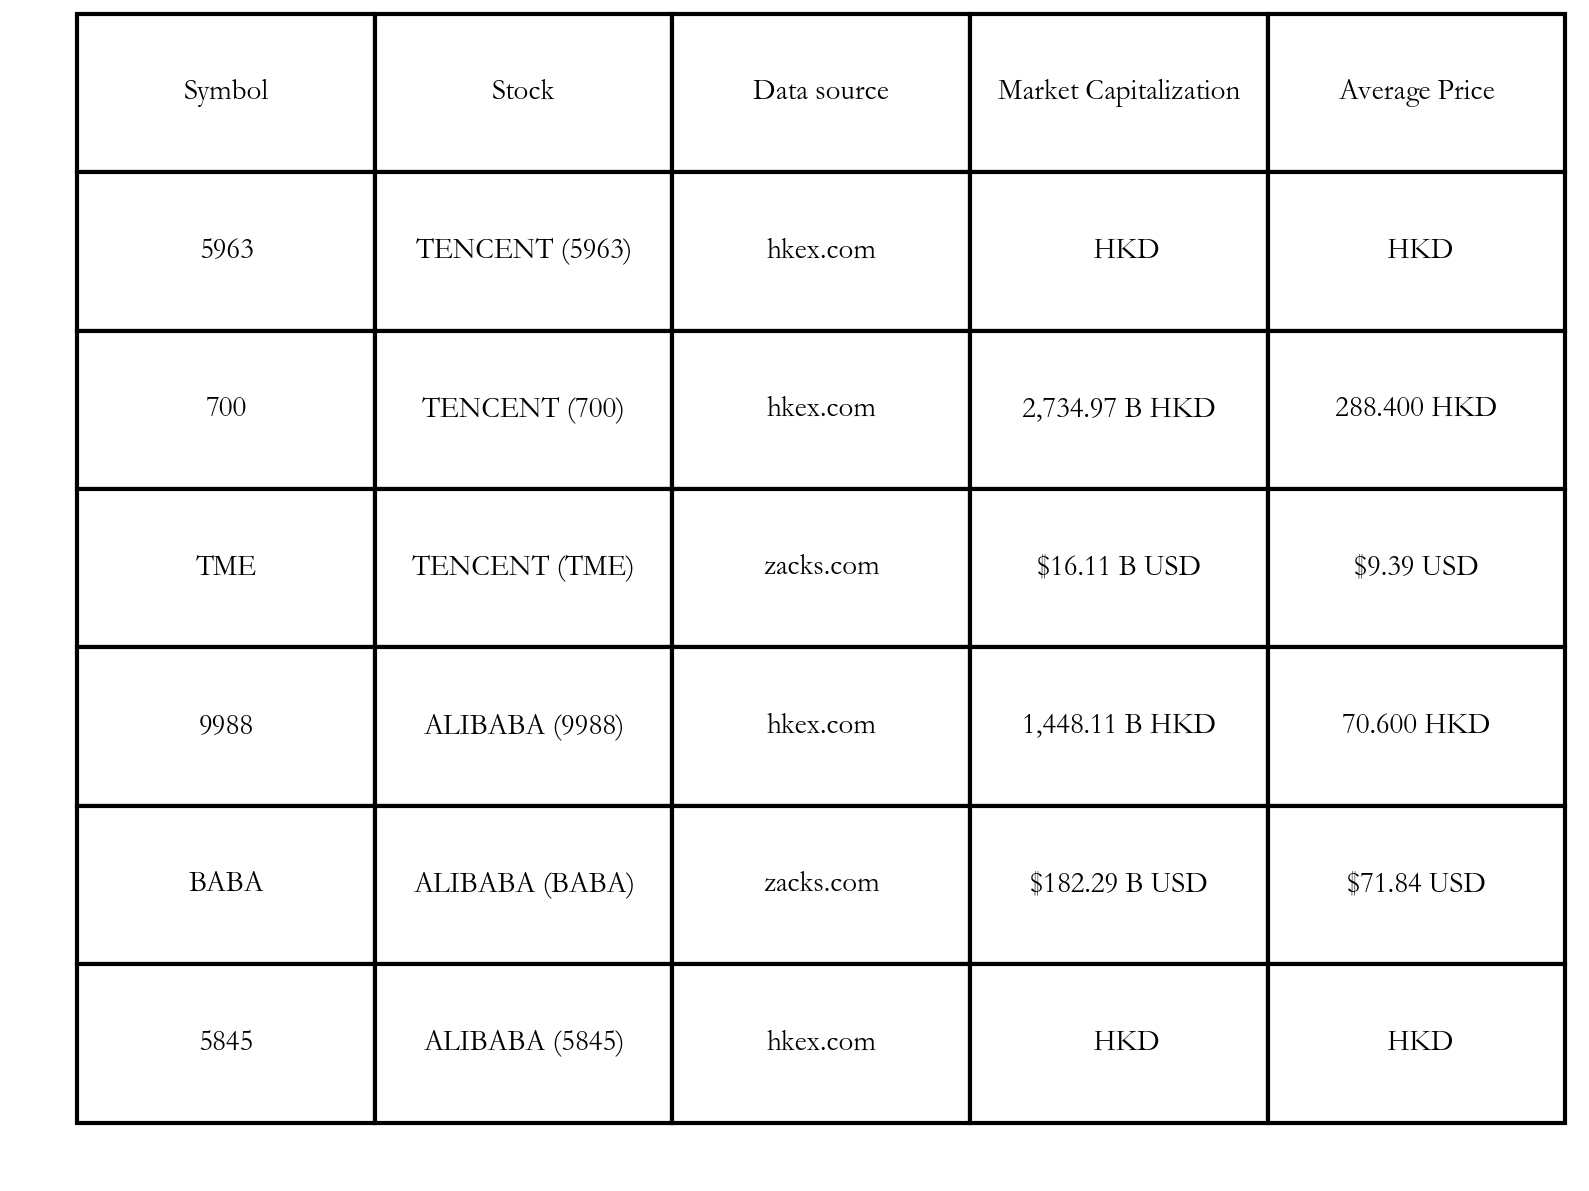
-
对比贵州茅台和中国移动的市值并画图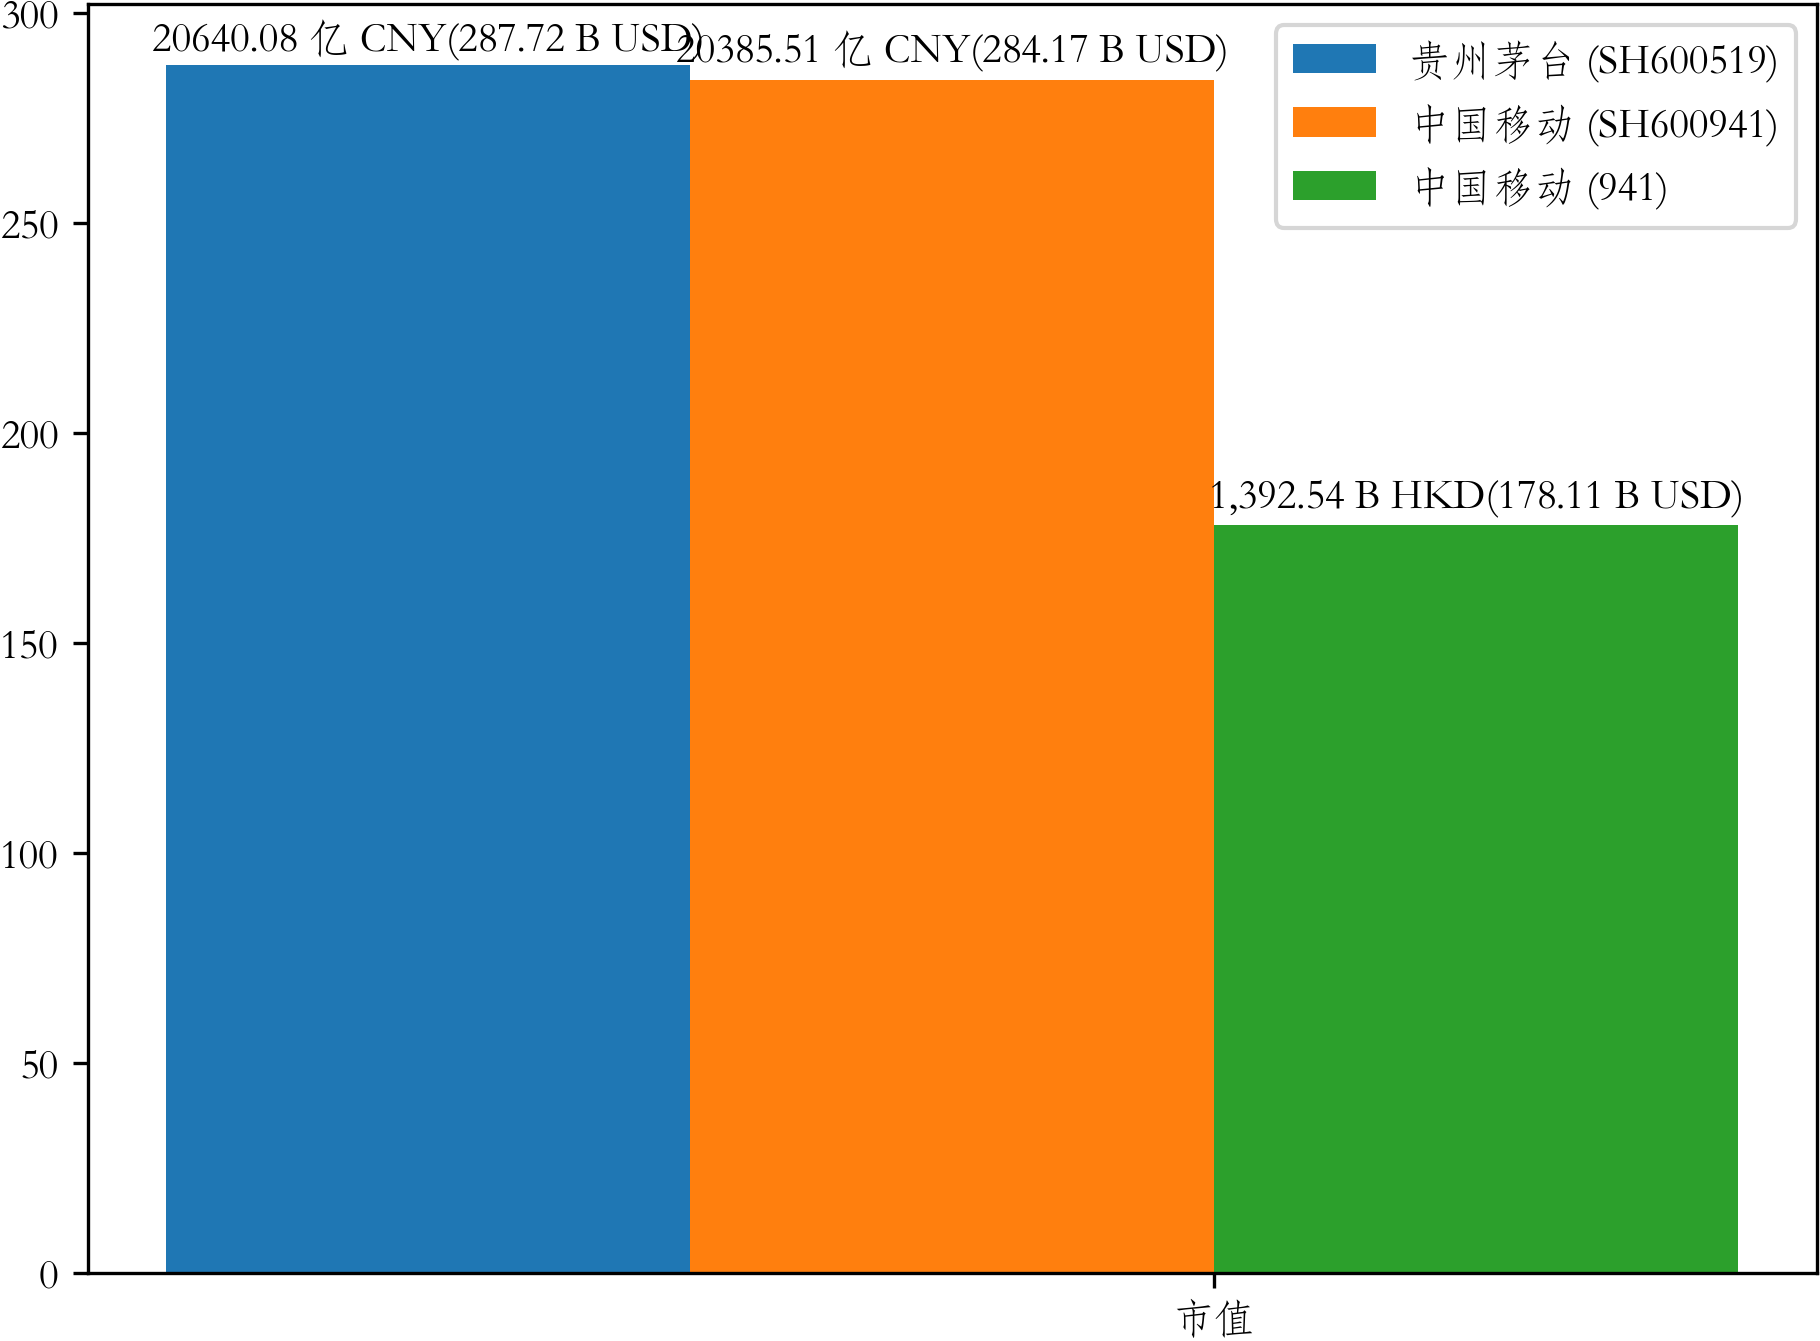
-
Compare Shell and Unilever market cap and draw a bar chart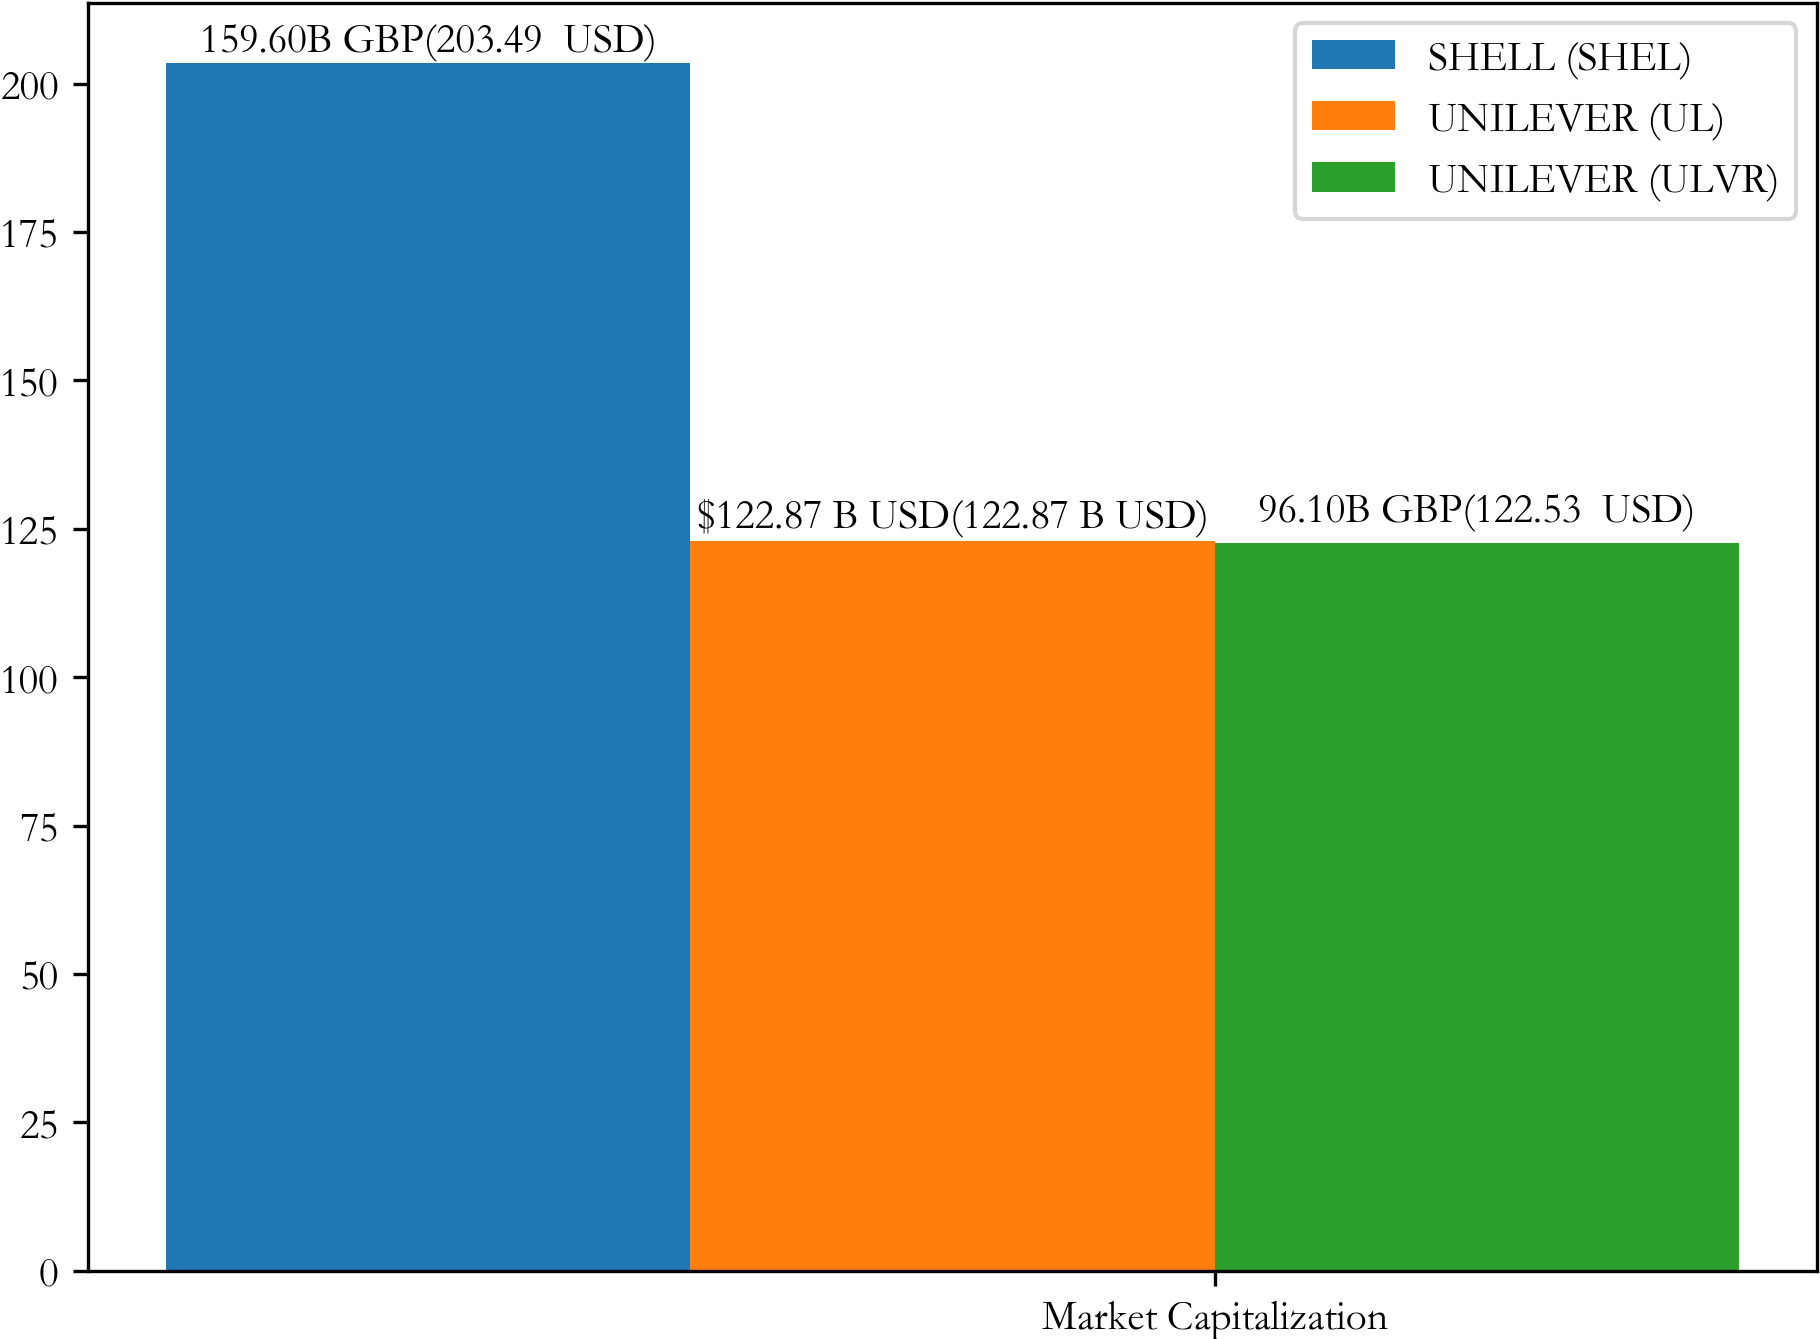
-
Compare Tata Motors and Infosys market cap in NSE and draw a bar chart
1. US Stock Market NASDAQ and NYSE
2. China Stock Market (Hkex Shanghai Shenzhen)
3.LSE London Stock Exchange
3.LSE London Stock Exchange
You can also try the stock chatbot service of deepnlp.org powered by ChatGPT by simply clicking the button below this blog. Wechat users can also follow the wechat public account "深语人工智能" and scan the QR code below

-